
Budget Blueprint Generator: Foundational Financial Synthesis
A guided, non-transactional AI tool that synthesizes raw user financial data into an interactive, educational, and actionable 'Budget Blueprint,' providing a structured knowledge artifact rather than attempting real-time financial enforcement.
How can AI turn raw spending data into an actionable financial strategy?
A synthesis engine ingests 3-6 months of raw transaction data and generates a multi-section 'Budget Blueprint': a summary dashboard, anomaly reports, and educational modules teaching principles like the 50/30/20 rule applied to your specific spending. Rather than enforcing a budget or providing transactional commands, the system surfaces patterns, flags structural anomalies, and provides knowledge artifacts. This enables users to make informed financial decisions grounded in their actual data.
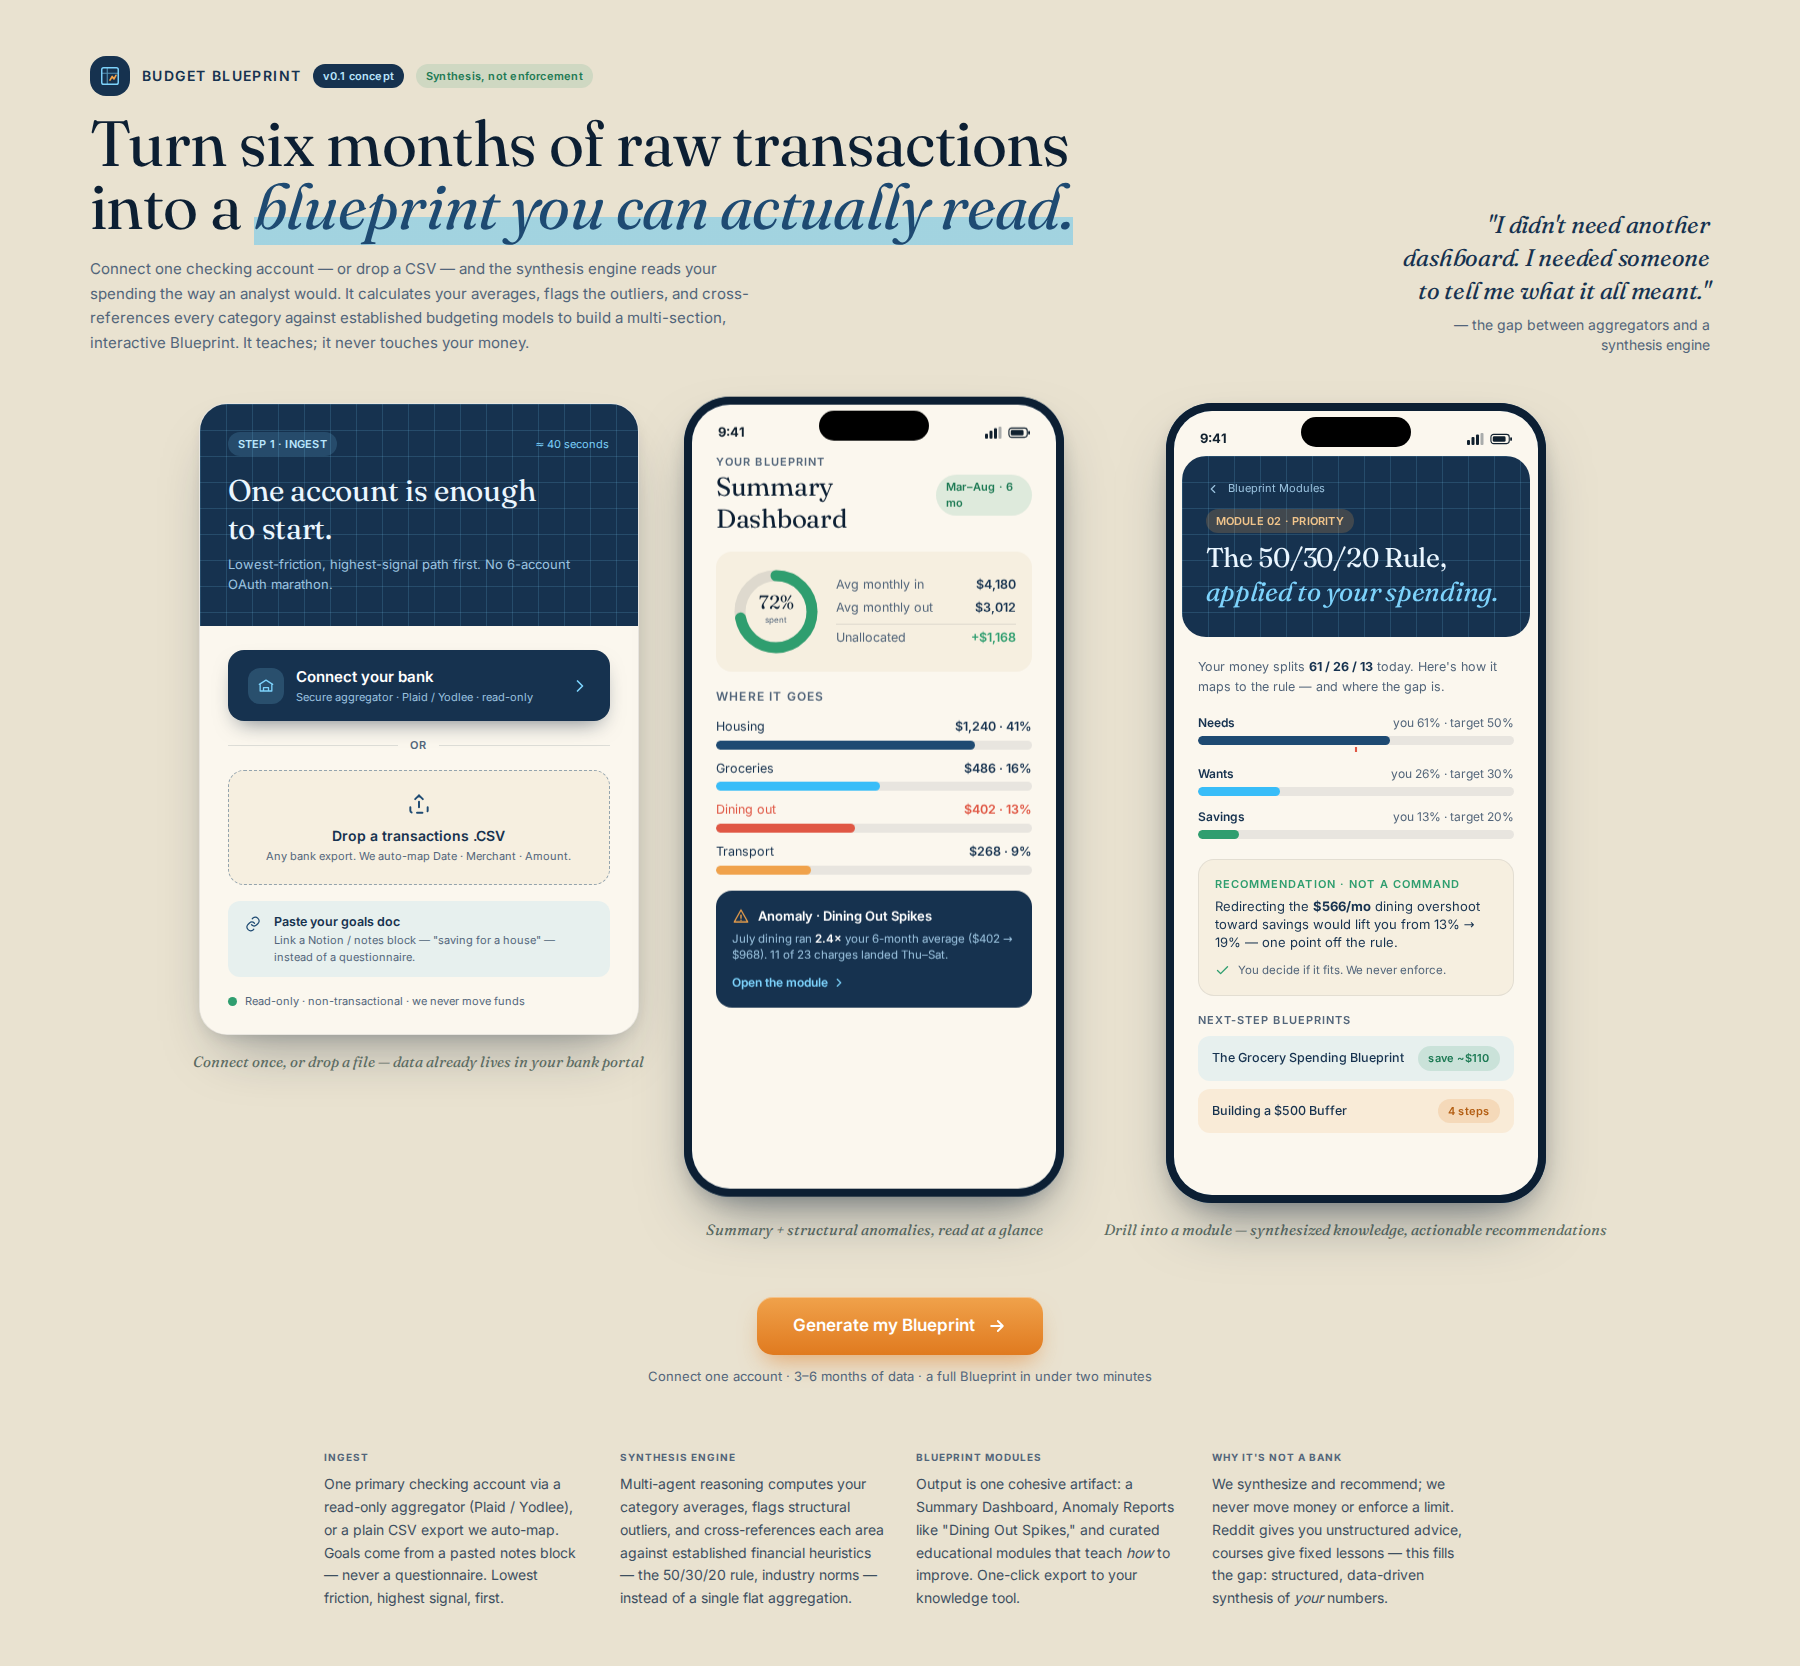
Process flow
Who it's for
Individuals new to personal finance or those overwhelmed by their raw financial data, seeking immediate structure.
Why they need it
Users need a structured, educational path to understanding their finances, but the current pain point is overwhelming data and lack of synthesis, not necessarily the failure to execute a budget. This targets the foundational knowledge gap by providing clarity, which is a solvable information problem.
What it is
A focused platform that ingests raw spending data (CSV upload or manual entry) and outputs a multi-section, interactive 'Blueprint.' The Blueprint analyzes spending patterns, identifies structural anomalies, and generates prioritized, educational 'Next Steps' blueprints (e.g., 'The Grocery Spending Blueprint').
How it works
- Data Ingestion: User uploads 3-6 months of raw transaction data.
- Synthesis Engine: The core agent processes the data, identifying patterns, calculating averages, and flagging outliers based on established financial heuristics.
- Blueprint Generation: The system generates the Blueprint, which contains: a) Summary Dashboard, b) Anomaly Reports (e.g., 'Dining Out Spikes'), and c) Curated, educational 'Blueprint Modules' detailing how to improve that area (e.g., 'The 50/30/20 Rule Applied to Your Spending').
- User Interaction: The user interacts with the Blueprint by drilling down into modules, receiving synthesized knowledge and actionable recommendations (not commands).
Differentiation
Existing solutions like s1 (Reddit) offer unstructured discussion, and static courses provide fixed knowledge. Our system fills the GAP of structured, data-driven synthesis. Unlike simple aggregation tools, we use multi-agent reasoning to cross-reference spending categories against established financial models (e.g., budgeting rules, industry norms) to generate a cohesive, multi-faceted educational artifact. We are a synthesis engine, not an execution system.
Implementation sketch
- Develop the core state machine focused only on the Blueprint generation lifecycle (Ingestion -> Analysis -> Synthesis -> Output).
- Prototype the 'Synthesis Agent' using 'memoryengine' to retain historical spending context and generate structured reports on identified anomalies.
- Design the user interface around an interactive, multi-tab 'Blueprint' view, focusing only on presenting structured knowledge and recommendations, removing all live API/enforcement calls.
First step: Build a minimal Python script that takes a sample CSV of transactions and outputs a structured JSON report identifying the top 3 spending categories and the percentage deviation from a hypothetical benchmark (e.g., average spending on groceries vs. national average).
Remaining risks
- Data Interpretation Bias/Inaccuracy: The system's analysis relies on heuristics and generalized benchmarks (e.g., 'national average' spending). If the user's spending patterns are highly unique, culturally specific, or tied to non-standard economic factors (e.g., seasonal work, unique local cost of living), the generated 'Blueprint' may provide misleading or irrelevant insights, leading to user distrust. — Implement a mandatory 'Contextualization Disclaimer' on every major finding, requiring the user to acknowledge the limitations of generalized benchmarks. For high-impact reports, prompt the user to input 1-2 local context variables (e.g., 'My city's average cost of living index is X') to ground the analysis.
- Feature Creep into Execution: Because the output is highly educational and structured, there is a massive temptation to add 'next steps' that require execution (e.g., 'Now, open this brokerage account'). This temptation will inevitably lead to scope creep back into the high-risk territory of financial advice/action, undermining the de-risked MVP. — Enforce a strict, non-negotiable 'Read-Only' mandate for the MVP. The UI/UX must visually and textually reinforce that the output is a report or blueprint, not a to-do list or command. The only action allowed is 'Save Report' or 'Export PDF'.
- Benchmark Source Decay: The value proposition hinges on cross-referencing user data against 'established financial models' or 'industry norms.' These norms are not static; they change with inflation, economic policy, and regional shifts. Maintaining an accurate, defensible, and comprehensive set of benchmarks is a constant, expensive data maintenance burden. — Initially, limit benchmarks to universally stable, mathematical principles (e.g., 50/30/20 rule, debt interest calculations) rather than relying on external, volatile 'average spending' data. Treat external benchmarks as a V2 feature requiring manual data acquisition.
Watch for: User asking 'How do I fix this?' or 'What should I do next?' without being prompted to use the 'Next Step Blueprint' module. This indicates they are treating the output as actionable advice rather than educational material, suggesting the educational synthesis value is not yet sticky enough. Kill criterion: If, after initial testing, users consistently report that the synthesized 'Blueprint' is 'too generic' or 'doesn't apply to my unique situation,' it suggests the core value is not the synthesis itself, but the human conversation that currently provides the necessary contextualization.
Sources the council used
Real-world evidence that grounded this idea — judge it for yourself.