
Rules-Based Proactive Alerting for SRE Capacity Management
A high-reliability, rules-based SaaS platform for Site Reliability Engineers (SREs) that continuously monitors mission-critical infrastructure telemetry, defining predictable resource exhaustion thresholds and providing actionable, early-warning alerts before service disruption occurs.
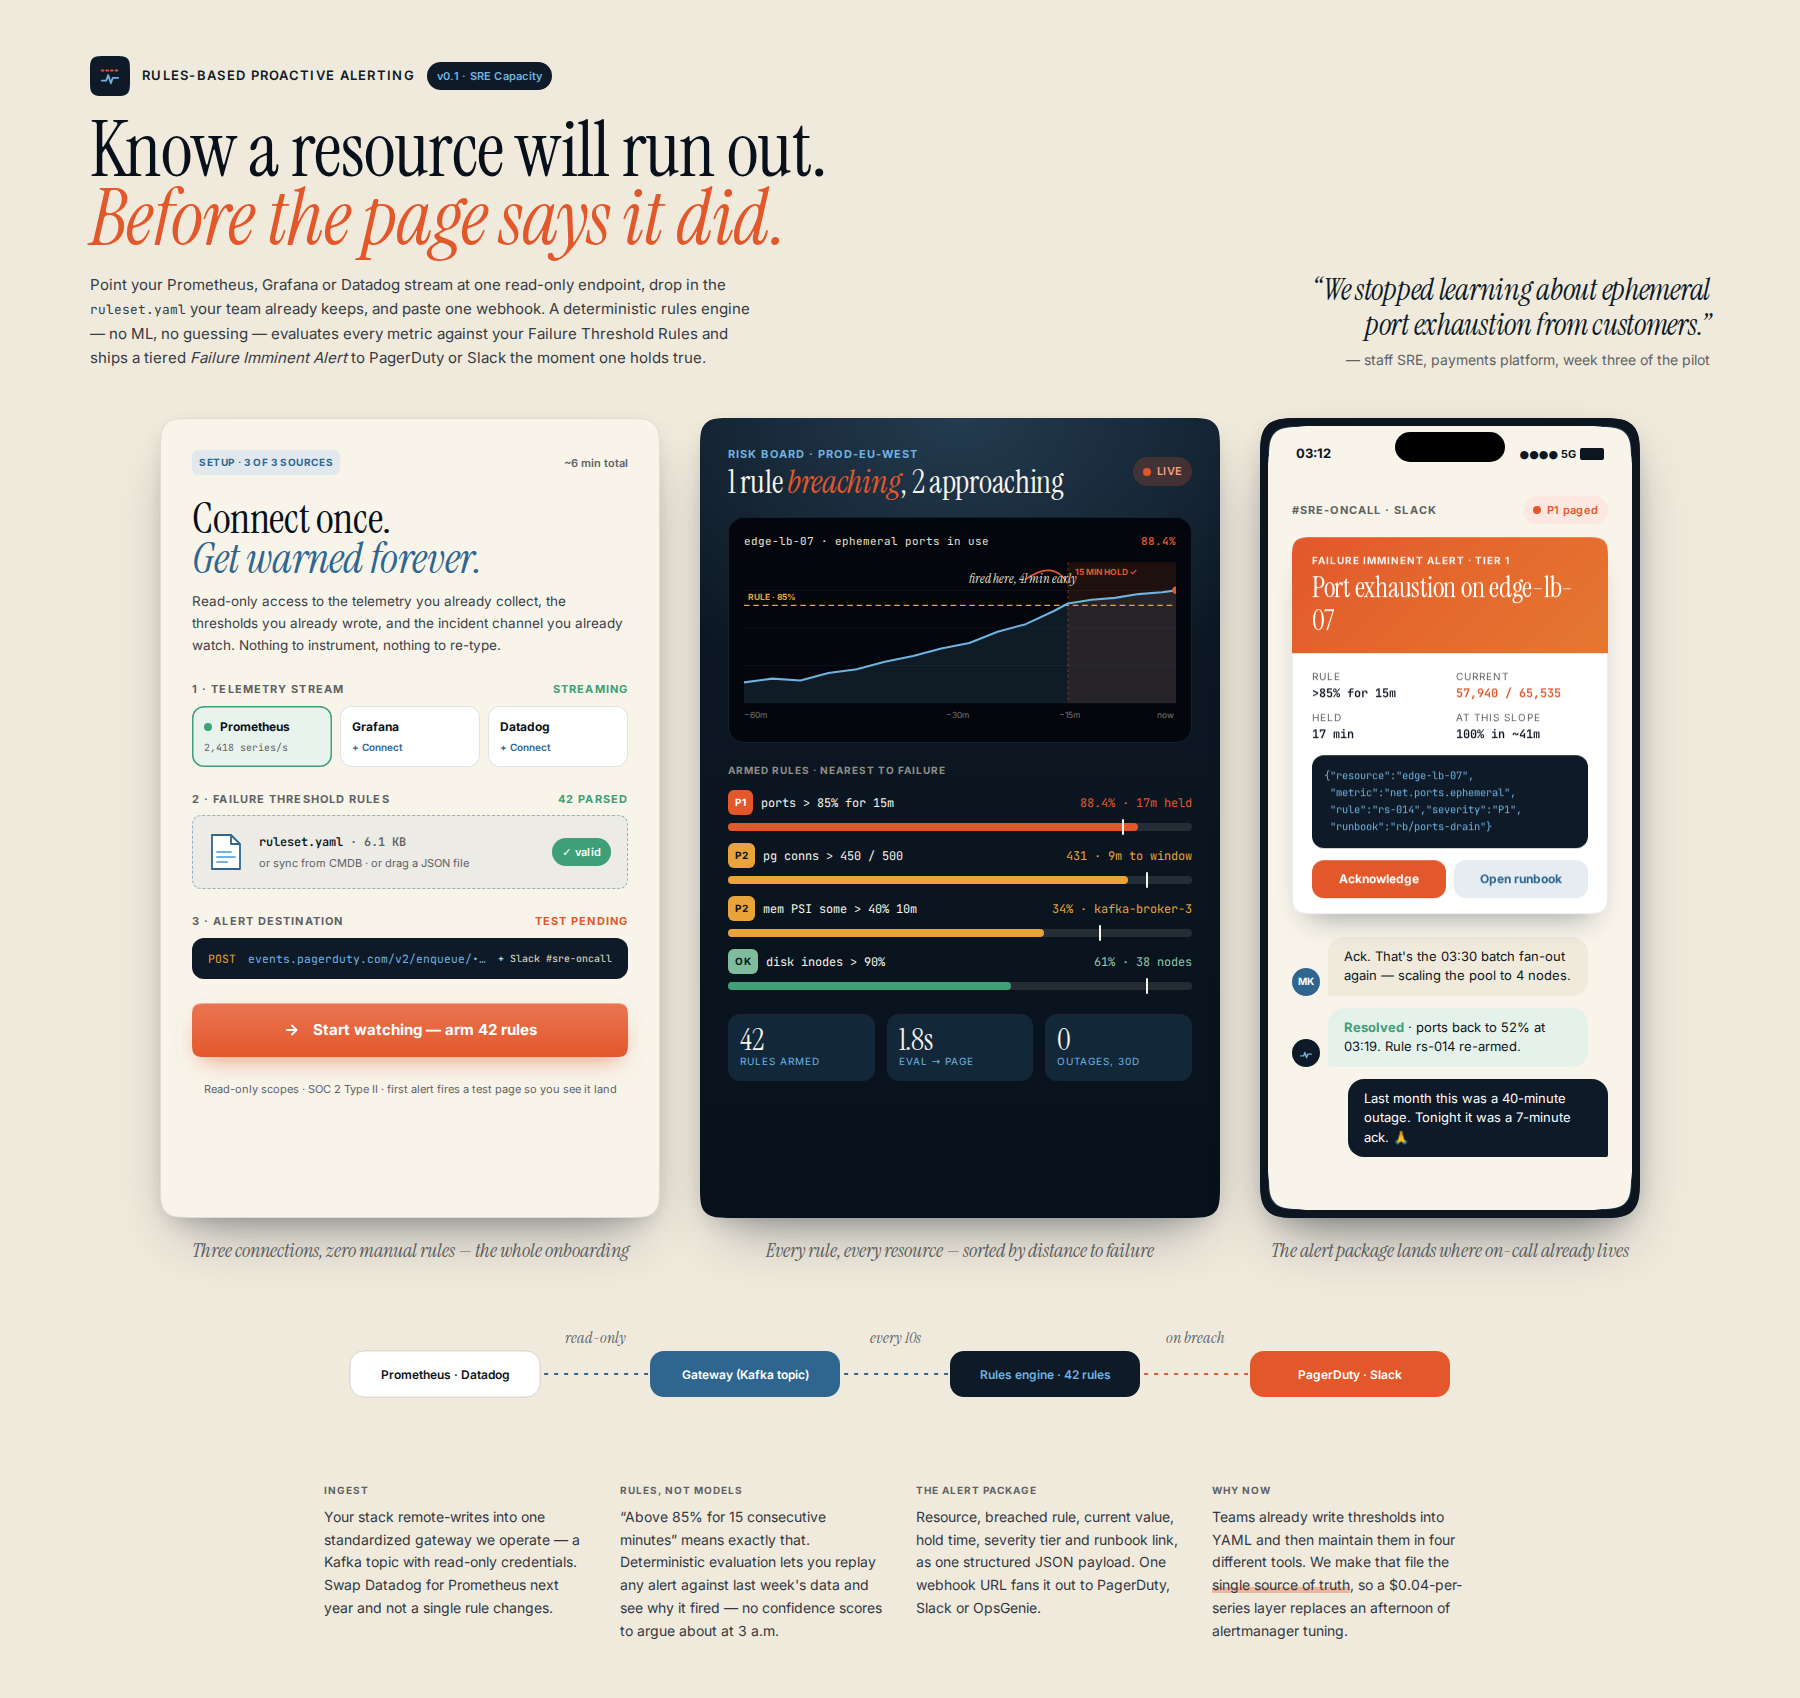
Process flow
Who it's for
DevOps Engineers or Site Reliability Engineers (SREs)
Why they need it
Intermittent, time-based infrastructure failures (e.g., port exhaustion, connection limits) are notoriously difficult to predict and cause costly zero-deployment outages. Current monitoring tools are reactive (reporting failures after they happen); we provide a reliable, proactive alert system that allows teams to plan mitigations and allocate resources before the failure impacts users. This shifts SREs from costly firefighting to planned, proactive capacity management.
What it is
A specialized agentic service that ingests real-time infrastructure metrics (e.g., port usage, connection counts, memory pressure) and continuously evaluates them against client-defined, critical thresholds (the 'Failure Threshold Rules'). When a metric crosses a pre-set, actionable boundary, the agent generates a high-confidence, tiered 'Failure Imminent Alert' package. This alert is delivered immediately via secure, enterprise-grade channels.
How it works
- Telemetry Ingestion Layer: The Core Agent establishes a secure, robust connection to the client's telemetry stream (e.g., Prometheus/Grafana via API).
- Rules Engine Layer: Instead of complex ML forecasting, the system utilizes a configurable, deterministic rules engine. The client defines rules (e.g., 'Alert if port usage exceeds 85% for 15 consecutive minutes').
- Alert Generation: When any configured rule is breached, the agent generates a structured 'Failure Imminent Alert' package, detailing the resource, the breached rule, the current metric value, and the severity.
- Actionable Output: The alert is pushed immediately to the client's existing incident response tooling (e.g., PagerDuty, Slack) and displayed on a proprietary operational dashboard, ensuring immediate engineering action.
Differentiation
Existing monitoring solutions are designed for retrospective logging or manual diagnosis, and even advanced platforms often require complex setup to manage multi-resource thresholds. Our system fills the critical gap of automated, multi-resource, rules-based risk alerting. We provide a highly reliable, plug-and-play 'Predictive Alerting' layer that abstracts away the complexity of setting up and maintaining custom threshold rules across diverse infrastructure stacks, fundamentally changing the SRE workflow from reactive firefighting to guaranteed proactive risk management.
Implementation sketch
- Build a secure SaaS ingestion layer capable of accepting core time-series metrics (e.g., port usage, network I/O) via a standard API/webhook.
- Develop a deterministic Rules Engine module (e.g., using a robust scripting language like Python/Go) that continuously evaluates incoming metrics against client-defined, time-windowed thresholds.
- Implement a reliable, enterprise-grade alert delivery pipeline (API/Webhooks) that formats the alert and pushes it to standard incident response tools (e.g., PagerDuty, Slack) and displays a clear, actionable status on a proprietary dashboard.
First step: Draft the technical specification for the secure API endpoint and the initial data schema to accept the top 3 most critical metrics (e.g., 'port_usage', 'conn_count', 'mem_pressure') from a single client's Prometheus/Grafana instance.
Remaining risks
- Vendor Lock-in and Data Dependency Risk: The system is entirely reliant on the client's existing telemetry stack (e.g., Prometheus, Grafana). If the client's internal infrastructure changes its data schema, API endpoint, or retention policy, the entire core agent fails, regardless of the rules engine's reliability. This creates a single point of failure tied to external, non-controlled systems. — Implement a comprehensive 'Data Schema Drift Detection' module. This module must continuously test the incoming data stream against expected schemas and metrics, providing an alert before the rules engine fails, allowing the client to fix the data source while the service remains operational with fallback metrics.
- Configuration Complexity and Maintenance Burden: While the rules engine is deterministic, the sheer number of possible metrics, thresholds, and time windows (e.g., 'Alert if port usage > 85% for 15 minutes, but only on Tuesdays') will quickly lead to an unmanageable, complex configuration layer. The system risks becoming a 'configuration nightmare' that SREs are reluctant to maintain or trust. — Enforce a strict, hierarchical 'Criticality Tiers' approach for rules. Limit the initial deployment to only 3-5 universally critical, non-negotiable metrics (e.g., connection count, memory pressure, network I/O). Gate advanced, custom rules behind a premium tier and only after the foundational 5 are proven stable.
- Market Saturation and Feature Parity: Large, established observability platforms (e.g., Datadog, Dynatrace, New Relic) are already integrating sophisticated alerting and capacity planning features. As the product gains traction, it will face immediate pressure from these giants to add features they already possess, forcing the product to chase parity and dilute its unique value proposition. — Focus the differentiation not on the rules engine itself, but on the workflow and contextualization of the alert. Build a unique layer that aggregates alerts from multiple sources (e.g., combining a 'Port Exhaustion' alert with a 'High Latency' alert) and provides a synthesized, root-cause probability score that no existing platform offers.
Watch for: If the initial sales cycle requires the product to compete on feature parity with existing observability vendors (e.g., 'Do you also support X metric?'), it signals that the unique, abstracted value of the rules-based layer is not yet understood or appreciated by the market. Kill criterion: If the primary use case shifts from 'Proactive Risk Mitigation' (addressing unknown future failures) to merely 'Advanced Alerting' (reporting known, static thresholds), the product has failed to establish its unique value and is merely becoming an expensive, complex monitoring layer.
Sources the council used
Real-world evidence that grounded this idea — judge it for yourself.